

The winners of the Stat+Stories #MemeMedianMode contest are Nynke Krol and Eric Daza.
Nynke Krol (@krol_nynke) is a statistician at statistics Netherlands who also submitted a stance mean that caused both, John and Rosemary, to actually laughed out loud when they saw her take on data normality.
Eric Daza (@ericjdaza) is a data scientist statistician who focuses on digital health, he submitted several means to our mean, median, mode contest, including one that made me flashback to my first graduate class in research methods, on causation/correlation.
Episode Description
At Stats+Stories we're lucky to have listeners who put up with John's bad jokes and our general shenanigans. In fact, you've listened to 199 discussions of the statistics behind the stories and the stories behind the statistics. To mark our 100th episode we asked you to submit statistical headlines and a haiku won. For 200 we took to Twitter using the #MemeMedianMode hashtag and this time those that rose to the top actually memes. Today we're talking to the creators of our top two. which you can see below.
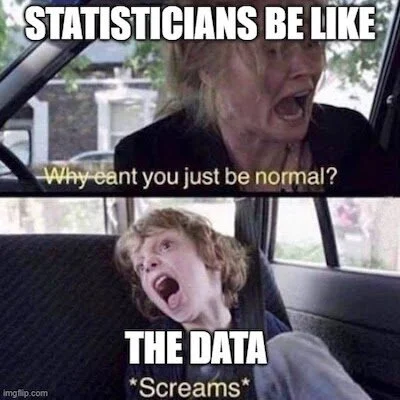
Nynke Krol’s submission.

Eric Daza’s submission.
+Full Transcript
Pennington
At Stats and Stories, we're lucky to have listeners who put up with John's bad jokes and our general shenanigans. In fact, you've listened to 199 discussions of the statistics behind the stories and the stories behind the statistics. To mark our 100th episode, we asked you to submit statistical headlines and a haiku one for our 200th. We asked you to submit your best statistical means on Twitter using the mean median mode hashtag. And this time, those that rose to the top were actually means today we're talking to the creators of our top two. I'm Rosemary Pennington. Stats and stories is a production of Miami University's departments of statistics and media, journalism and film, as well as the American Statistical Association. Joining me as panelists, John Bailer, Chair of Miami statistics department, Richard Campbell is a way our first guest today is Nynke Krol. Krol is a statistical researcher with statistics Netherlands, she also submitted a stats meme that, frankly, caused both John and I to actually literally laugh out loud when we saw it. Nynke, Thank you so much for being here.
Krol
Thank you, Rosemary, and congratulations on 200 episodes.
Bailer
Thank you. Thanks. Great to see you, Nynke.
Krol
Yeah, great to see both of you. Yesterday meme that I submitted was actually the one I first saw it with when it was about 2020. In general, you know, I have some feelings about the year 2020 from the Australian psychological horror film, the babadook. And the template is like, mother, she's driving. And then she has a six year old son in the backseat. And she's like, screaming to her son in the backseat, why can't you just be normal? And then the boy in the backseat is like, oh. And so I think that's like setting up most of us who have shared a car once with like a six year old, kind of it is very familiar. Yeah. So I added two dice to like the mom, I added in those big bold meme letters, censorship, statisticians be like, and then to the boy, I added, like, the data. So what you end up with is like, statisticians be like, why can't you just be normal? And then the data is like, Oh,
Bailer
You know, I, I love how you're telling us? I mean, I wish you know, we I hope we could, it would be great to be able to go visit with a video here because the drama, The motion that you bring to this, I mean, I think that you have a career in this on the stage Nynke. I mean, it's a
Krol
Thank you, John, I'll keep that in mind. If I ever consider a career switch.
Pennington
It just resonated with me so much when I saw it, because there's so many times when I've been working with data, and I'm just like, what the hell happened here? Why did this turn out that way. And as soon as I saw it, I was just like, yes, this is my experience, crunching numbers so many times.
Bailer
I you know, and I found myself thinking about the, you know, the, you know, any intro stat class. You know, the students, you know, what they might think is, you know, they might have the, they might believe that that the mother's perspective from the front seat is true for all that's done in the field and the discipline. So that also tickled with it tickled me when I when I saw that guy, sorry, Rosemary,
Pennington
I know, I was just as I was gonna ask if you're, if your main submission was motivated by any particular problem that you were dealing with it?
Krol
Uh, well, I do, I do believe that, you know, especially when you're coding and and then and, and everything in practice is so it's so different from like, my nice little theory. I like the formulas and then especially I think with the prognosis of like, the amount of people and amount of deaths and things like immigration and then so you we have all these nice nice formulas and then you have the data, the data you just don't know right? You don't know what's gonna happen with the amount of people and anything can happen and the real world just frustratingly doesn't always behave like, our nice, nice formula theories.
Bailer
Well, that's a great segue. The question I had is so other than producing brilliant means, I mean, do you do other Things that you know, at work. So, so I thought what I was gonna ask you is, what kind of problems do you typically work on? You know, and where are you where you're based.
Krol
So I'm like, I'm at statistics Netherlands. So that's the national statistical offices of the country of the Netherlands. And within that, I'm like, consultant for one of our big divisions, sort of the social, economic demographic part. So it's great because I get to visit other teams that have like, specific problems and issues and, and work with them on that. So yeah, and that's, that's always what attracts me to statistics in the first place, I hear that the problem sets that you get to work and are so diverse, and that you, you know, you get to play in everyone's backyard, as they always say. So that's, that's what I do. So it could be like, something about like, brass or something about like health care or something about like debts, you know, with, which was really relevant in the in the COVID times, and so whenever something is, like, extra relevant, there's a higher chance that that I get to work on that. So it's, it's a really great position to have. And then I mainly program in R and python. And
Bailer
So one of the things that we talk a lot about on this program is kind of communicating concepts. And that you know, and I know that within your organization, I mean, there's a major part of it is communicating statistical results. So the general public, what, what kind of, what kind of work? do you do? Have you been involved with in that regard? I mean, what kind of Have you been involved with any of those types of communication efforts and producing for a general audience? And what are some of the things that you enjoy about that or challenges you find in that?
Krol
Well, I think when I when I started working at it, statistics Netherlands, which was in 2014, communicating statistics was like a really big issue that was the topic that we shouldn't like, hide our numbers in those those lively reports, you know, any longer with all those really specific definitions and and that we should make it more and more accessible. So I think that has been in continuous topic. Yeah. During, during my my time here, that sort of culture shift, you know, from from going from, you know, this sort of academic mindset to, like, what would society benefit most from our numbers? How can we make them more accessible? Yeah, that is a continuous conversation. Thank you.
Pennington
Nynke. Before we wrap up, I guess I'm just wondering how you got interested in in working in statistics, in the first place, suddenly, we asked a lot of our guests but given sort of what you seem to be working on at statistics, Netherlands, I wondered if you could talk, you know, very quickly about sort of what drew you to this particular field.
Krol
Um, so I did an undergraduate degree in psychology. And, but I did like I chose maths and physics subjects in high school, but then I chose to study psychology. And during that, I was like, well, I find statistics a really interesting subject. I was one of the, that's not very typical psychology student, but so that was where I was interested in most, and also the problem solving mindset and really grinding a problem. Part of it. I was actually, when I was thinking about what I wanted to study, I was really, you know, going back and forth to all those different majors, because my interests are really diverse. So that's also one thing that really attracted me to it. And then we had this new master's program at Leiden University. It was at the mathematics department, so a master of mathematics, and then a specialization, statistical science, it was at a time. So that seemed like a really great opportunity, because they took students from all these different backgrounds. And so I applied to that, and it was really difficult. Yeah, it was because I didn't have like a background in mathematics. And so I failed really bad at like the start of the program. And then in the end, I like, when I have an interview, I always say like, my first grade was like four out of five out of 10, which is really, really failing. And then my last grade was 10 out of 10. So I'm usually adapted to lightning to university and that and that program, yes, they really taught me a lot about statistics and then I know that that's what I want to do.
Pennington
Well, thank you so much for joining us today. I Really, I really love your meme. I was looking at it again before we came in to talk to you and it made me laugh again because it's just I mean to me it just feels like something so universal like we've all been in that space where you're just like what is happening with all of this data? So for me it was like perfect
Bailer
No, I'm with Rosemary. That was brilliant. And thanks for participating. I mean, thanks for submitting something. It's fun to interact with people and it was such a treat when I saw who you know, so it was, who was from it Oh, great. This is like this is cool. This would be fun to chat about what the thinking was and what led to this. So thanks again for doing this and for engaging in stats and stories.
Krol
Thank you. I'm glad it resonated with you. And thank you for the invite. I'm really honored to have been part of the 202 episodes. And I'm, I guess many more will follow.
Pennington
Hopefully, let's knock on some wood.
Bailer
We hope so. Thanks, Nynke.
Krol
Thank you.
Pennington
Our second guest is Eric Daza. Daza is a data scientist and statistician who focuses on digital health, he submitted several means to our Mean, Median mode contest, including one that made me flashback to my first graduate class and research methods. Eric, thank you so much for joining us tonight. And I want to ask what made you decide to focus on correlation causation for this particular meme? And I was wondering if you could also describe it?
Daza
Sure. Thanks for having me on. Yeah, well, causal inference is really sort of core to my nerdy passions as a statistician. And so that's constantly on my mind, what made me focus on it was, you know, I've been in data science and statistics practice for like, 18 years now. And it's constantly a mistake we make so you know, it was this realization, like, Oh, it's a trope. It's an aphorism, because we keep making the same mistake. And so I was thinking, why is that? Oh, it's because it's instinctive. Okay. And so I kind of, yeah, I was like, that means came to mind for me.
Pennington
The meme is of the highway and correlations in one direction and causations in the other direction, the car is veering off the highway. I can't remember which direction the car is going in, though.
Daza
Yeah, it's going towards causation. Because that's our instinct is we want to see causation and everything.
Bailer
Yeah. So you want to take the cause a look, to me, it looked like this is the exit, you want to take the cause? You want to leave the correlation highway and take the causation exit.
Daza
Exactly. That's what we're kind of naturally wired to do that are
Bailer
Labeled, though you had that there was like, it was an intuition. That was the label on that, that sort of,
Daza
Yeah, I think it was like human intuition was in the car. It's just like, all right, yeah.
Bailer
Yeah. What's causing you to sort of trend in that direction? I didn't realize that you were causing flashbacks for Rosemary. Yeah, I was.
Pennington
I just remember the thing that came up over and over again, was with my poor methods professor who was explaining to so like, you know, it's the first graduate level course we had, and there are people in there who were not going to go on and do PhDs, but had to take the class. And he just kept stressing correlation does not equal causation. And my husband helped me with my thesis and dissertation work. And I was sort of talking him through like some statistical stuff I was doing and was trying to explain this, I think he now will just throw a joke at me when I'm talking about data or frustration around something. And he's like, Well, you know, correlation doesn't equal causation. And I was like, Ah, you know, so it's like this moment of like, Oh, yes, yes, I felt that very, very deeply.
Bailer
This was sort of resonant with sort of your practice and statistics, but also your, your, you're working a lot of times in a sort of a formula pharma context, is that correct?
Daza
I used to, it's more nowadays, it's a health data science contact.
Bailer
Yeah. Tell us a little bit about what that kind of work entails?
Daza
Sure, so that's more like, a lot of really, if I were to sum it up exploratory data analysis. So there's a lot of like, a lot of a lot of questions where we don't really know the answers. It's much less similar to a pharma biotech context where it's like, here's a drug or treatment, and we have an idea that this might be at the effect. And so we're going to design our study around that. In this case, it's more like we're not even sure how to ask the question what the data are like. So it's really hypothesis generating and exploratory. And so those are the kinds of things I think in cases like that it's even more important, right? Because in the pharma context, correlation doesn't imply causation. It's always there. You know, that's why we do the RCT. But when you're exploratory, it's a lot more nebulous. We're not quite sure we didn't necessarily randomize something or if we did, we're not quite sure about the mechanisms so it is a little harder to parse out.
Pennington
I wonder what advice you would give to researchers as they're working on their own analyses to help them sort of, besides sort of the mantra correlation does not equal causation. But what can we do to make sure we don't get sort of caught in that trap? Because it is really easy to be like, Oh, yes, this causes this one thing and want to sort of find that kind of easy solution to something?
Daza
Yeah, um, I think one thing is, you know, folks talk about Simpsons paradox. I think Simpsons paradox has been on the Twitter feeds and the Twitter streams recently. But that's something to think about. I, you know, I like to bring up the example of like, the ice cream doesn't cause homicide. Yeah. correlation. It's kind of a classic example. It's a nice example. But it doesn't really help people in the field, because you're like, that's great. What does this look like in my data? You know, right. And that's something that's more tangible, I think, would help.
Bailer
So, you know, I'm intrigued that you also have been involved in writing a blog for quite a while. So you have this, you know, sort of stats of one blog. And I, I wanted to, to ask you, what, what inspired that and also what inspired you to partner with a psychologist and a computer scientist in terms of kind of framing this blog?
Daza
Yeah, great question. The partnering is actually fairly recent. But so going back to the beginning quickly, the inspiration came from my work using no one or single case methods, and analysis methods and design methods. In my postdoc, it was something I came to on my own. Towards the end of grad school Professor Susan Murphy came to give these, she came to give these, basically their keynote talks at my grad school. And I was inspired by them, she does a lot of work with personalizing treatments. But I also realize, geez, and not that great at math. This is hard stuff. But I love causal inference. But oh, there's this other adjacent field called n of one trials, which are basically crossover trials for one person, you use yourself as the baseline, and you randomize yourself to different treatment levels. You know, they work really well when your outcome goes back to baseline. Anyway, I realized this is also good for chronic conditions. And in fact, that's what they're used for. Someone very close to me has irritable bowel syndrome, or IBS. And so I thought, How can I use this brain and the stuff I've crammed into it to sort of help out this person as much as I can. And so that was the genesis of it. How it became a website has to do with early last year pre pandemic, I was asked to do an Instagram takeover for a different group of Filipino professionals in science and technology and math group. And I did it for a week. And I thought, well, there was a lot of work, but not too much work. And I pretty much had to write a blog. So why don't I turn my one idea into a blog. Since I'm not going into a faculty position, this will sort of be like my research statement. And now it's a blog. And voila, the year and a half later, here we are.
Pennington
What got you into stats in the first place in this conversation, you just mentioned that you didn't see yourself as a math person. So I wonder what sort of got you into stats?
Daza
Yeah, totally. Um, I started off. And that speaks to the difference between growth and fixed mindsets, right, that I learned about later on. But I started off as a neurobiology major, I loved it, it was great. But I also realized I didn't really enjoy the actual work part, you know, so doing the lab work and all that. And I wanted to find something different, but it was, I was at the end of my undergrad, I happened to take a cognitive studies class where we had to design a psychological experiment. And I loved cognitive studies, first of all it is awesome. It's like doing magic shows as your research. You know, fool people into thinking you're doing one thing, but you're doing another thing. ethically, of course. So I love that. Yeah, right. Yeah. Like
people go divine. Um, but yeah, so so I realized during that time, like, oh, man, I really liked the data analysis and study design components, but it was ending, my undergrad was ending, But lo and behold, my college opened up a brand new Master's in applied stats that was one year long. So I did that and just kind of took it from there. And the more and more I got into stats, the more resonated with like, just things like not stats related like oh, yeah, you know, bigger sample means you have a better idea of what's going on. It's kind of like looking at Yelp reviews or trying to understand, you know, an argument you're having with somebody else. The amount of uncertainty has to do with how much knowledge you have going into it, emotional and intellectual. So, all these like super nerdy things started jelling, and I just got deeper and deeper into it. Now here I am.
Bailer
I've not done much with it. I don't know a lot about this. No one single case method. I know there have been, there's literature that's very extensive on this, this kind of stuff. But I you mentioned like IBS as one application of this and that you're doing this in a crossover where you would be, essentially individuals would be randomly randomly assigned to have one, one sequence or another within within this, can you talk about some other examples and, and some other areas of why this is needed and when this is being used?
Daza
Yeah, that's a good jumping off point, too, because other areas include the general use cases in health at least include chronic conditions that are highly idiosyncratic. So IBS is a target case, because there are many different triggers and symptoms, the symptoms are all fairly similar, but the triggers are varied. And one person's trigger might not be a trigger for another person, or maybe it helps the other person, but it hurts you. So there's even variability and heterogeneity and the definition of the trigger, how long it takes to affect you, across people. So when you're in a situation like that, doing an RCT doesn't really yield much because there's no average effect anymore of a trigger. Something like an N of one design is really handy really quickly that describes other conditions like chronic pain and asthma, and N of one trials, and they're cousins in psychology, single case experimental designs are experimental by nature, by definition. And that gets at your correlation doesn't imply causation. Because you're literally causing the change. I was interested in working on the other side, where we only have passively collected data, maybe from your wearable device or from your app about your symptoms. And now, we're trying to parse out correlation from causation. By using causal inference methods that we use in epidemiology and political science and all these fields. I'm porting them over and saying, Hey, we can treat one person as the population of repeated people over time. Now we can address confounding. So that was kind of my, my friends here move, like I'm gonna push into that space, because there's not a whole lot there.
Pennington
I wonder before we wrap up, if you could talk about what it's been like for you to try to communicate statistical information in the exact accessible ways because you mentioned the Instagram takeover. So I'm not sure exactly what that entails, you've got your blog, and now you've got the means that you produce for our contest. And I wonder what it's been like trying to figure out how to explain sometimes complicated ideas for what feels like a broader population.
Daza
Yeah, it's been really eye opening because I'm, I, when I first started, first of all, I never thought I'd kind of like the statistics and never thought I'd go into blogging, Never thought I'd do social media stuff.
Bailer
Things for some, or?
Daza
Yeah, exactly. But in the process of doing this I started to write the blog, I realized, this is pretty natural for me, I guess, you know, like just talking to people and coming up with wordplay. I love wordplay, I love coming up with pithy little things, just for myself to help remember, as mnemonics, and it turns out, this works really well in a Twitter context or an Instagram context, or a LinkedIn context. So the challenges are, starting with at the beginning, when I wrote my first blog post, you know, they're pretty technical, detailed and really tight, not super tight, but it's my academic training, right? When you're trained in a doctoral program to be really tight with your arguments. And then I started to realize, Oh, the audience, they're not really going to grill you on this as much so you can kind of relax and so my later blog posts are shorter, more concise, hopefully more concise. Hopefully, I'm more entertaining. Yeah, the most pithy of them, are these like memes, because, because I, so part of my background is I did a lot of theater in college. So maybe that's a giveaway.
Pennington
Okay, that explains some. Well, Eric, thank you so much for joining us today. And thank you so much for participating in the contest. It's been really great to see what everybody contributed.
Bailer
Indeed. Thanks a ton, Eric.
Daza
Sure. My pleasure. Thanks for having me on.
Pennington
And we'd like to thank all of the listeners who've been continuing to listen to our conversations with me or otherwise for the last 200 episodes. Before we wrap up, though, there is one more Thank you. We have to make Stats and Stories co founder Richard Campbell is stepping away from the program. Richard's been a champion of making statistical information more accessible to the broad public, as well as a supporter of efforts to help journalists become more comfortable reporting on data and stats. Importantly, he's been a nice counterbalance to John's puns and jokes. So thank you, Richard, for getting us off the ground and running and personally, for convincing me that I should sign on to this.
Bailer
Yeah, let me say and Richard's been a great, a great partner and colleague and I certainly We have cherish the time that I both worked taught and then podcasted with Richard and he's been a delightful friend and and partner in this process and bringing it Rosemary on was one of one of his great insights to
Pennington
Stats and Stories is a partnership between Miami University’s Departments of Statistics, and Media, Journalism and Film, and the American Statistical Association. You can follow us on Twitter, Apple podcasts, or other places you can find podcasts. If you’d like to share your thoughts on the program send your email to statsandstories@miamioh.edu or check us out at statsandstories.net, and be sure to listen for future editions of Stats and Stories, where we discuss the statistics behind the stories and the stories behind the statistics.